Dashboard
Powerful Dashboard for In-Depth Reconciliation Analysis
The Dashboard is the heart of our Reconciliation Feature, offering a detailed and easy-to-use view of your reconciliation results. This interface gives businesses instant access to the outcomes, empowering you to compare data from different sources, find discrepancies, and take action based on the insights.
With features like selecting data pairs, viewing detailed results, and downloading reports for further review, our Dashboard ensures you have full control over your financial data. Whether you're monitoring reconciled and unreconciled transactions, spotting mismatches in amounts, fees, and taxes, or tracking missing data, the Dashboard provides everything you need for effective reconciliation management.
Guide for Viewing Reconciliation Output
This guide provides a simple, step-by-step walkthrough for accessing and analyzing reconciliation outputs on the Portone dashboard, with Lazada orders and settlements as examples.
By following these instructions, users can:
- View Financial Data: Access detailed financial information for transaction reconciliation.
- Select Data Sources: Choose from configured data sources to focus on specific order or settlement data.
- Apply Filters: Use filters such as date range, country, and brand to refine search results.
- Switch Metrics: Toggle between "amount" or "count" metrics for a tailored data view.
Additionally, users can interact with the Sankey chart to examine transaction flows and pinpoint mismatched data, making it easy to identify areas that need attention. This guide also covers the downloadable detailed reports, including raw data, for further analysis.
Key Features
- Data Pair Selection: Choose pairs of data sources to compare and see the reconciliation results. This helps you focus on specific data, like comparing your internal records with data from a Payment Service Provider (PSP) or Marketplace.
- Detailed Reconciliation Results: Get a full view of reconciled and unreconciled transactions, including matched and unmatched data, missing transactions, and mismatches in amounts, fees, taxes, and quantities.
- Customizable Views: Filter and sort data to focus on what matters most, like transactions from a specific date, source, or type. This makes it easy to quickly spot and fix issues that are important to your business.
- Downloadable Reports: Download detailed reports for each reconciliation category—reconciled, unreconciled, and mismatched transactions. Use these reports for further analysis, records, or compliance purposes.
- User-Friendly Interface: Our Dashboard is designed to be easy for anyone to use, ensuring even non-technical users can navigate, find the information they need, and act on the insights.
Sankey Chart (for Reconciliation Flow Analysis)
The Sankey Chart in the Reconciliation Dashboard shows a clear, visual flow of how transactions/orders and settlements are processed. It breaks down results to show where transactions/orders are matched, unmatched, or have discrepancies between data sources. This helps businesses quickly see how transactions align and make informed decisions.
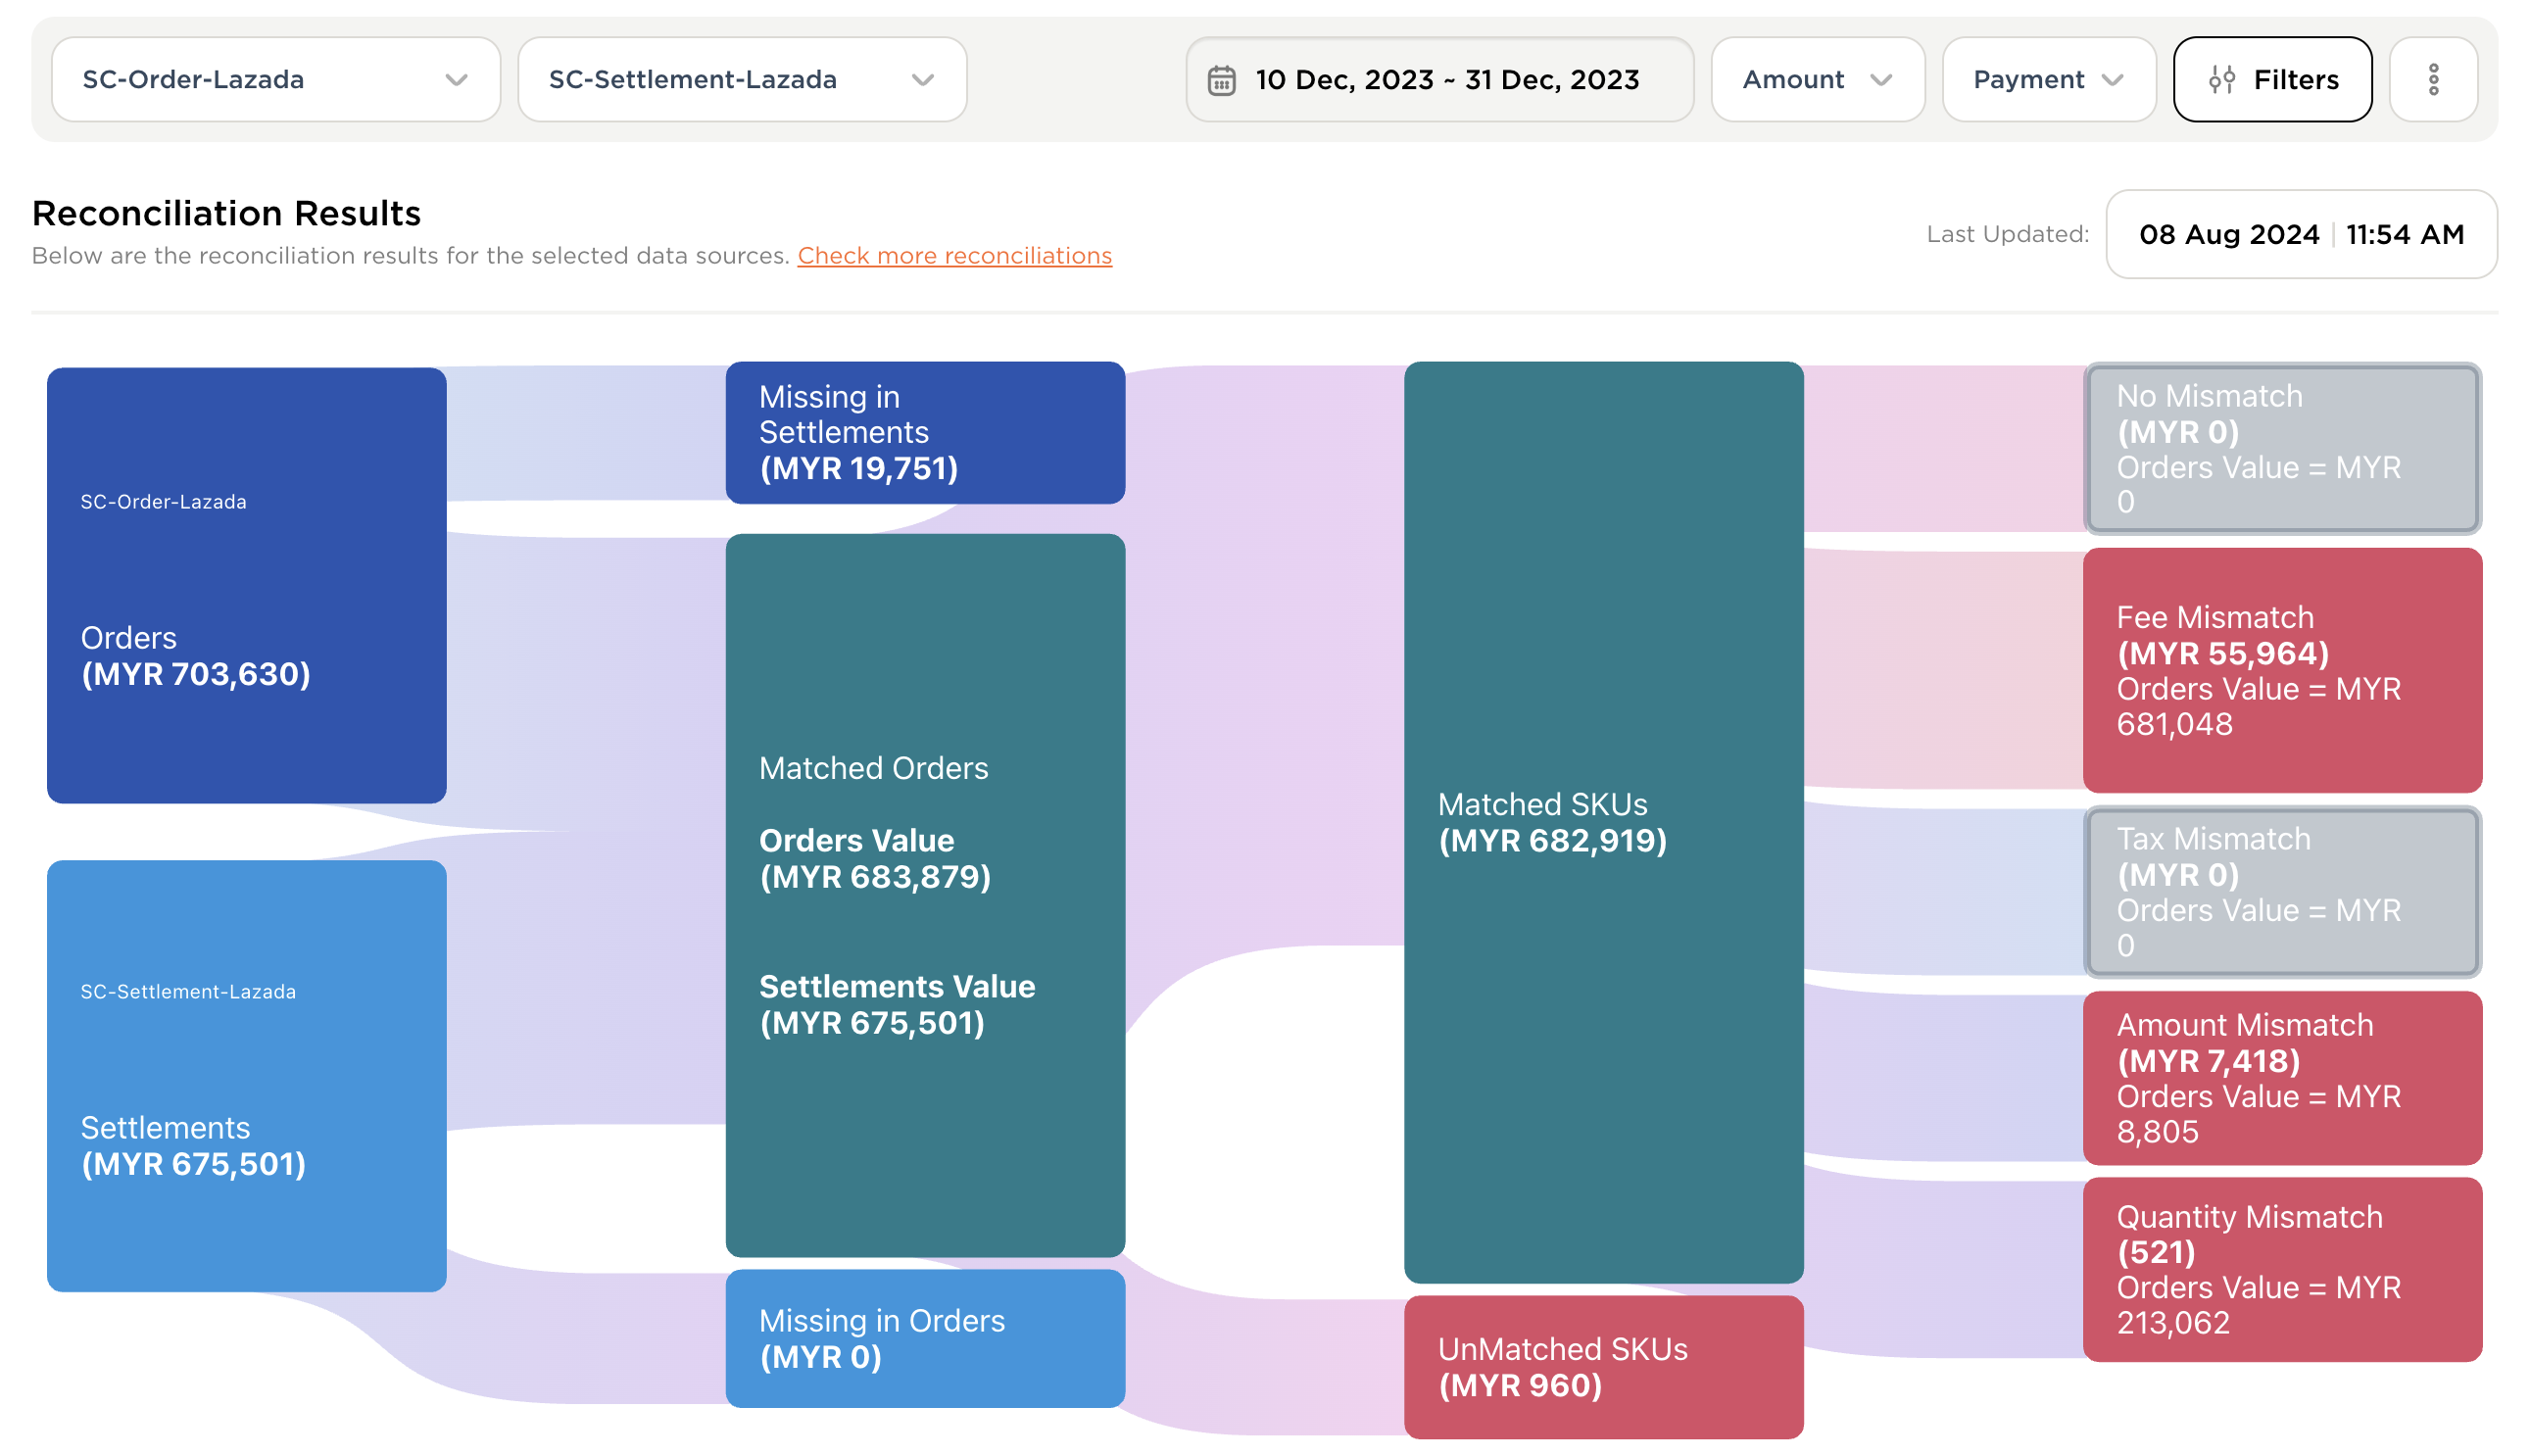
Key Insights from the Sankey Chart
Overview of Raw data records
- Total Transactions/orders and Settlements: The chart starts by showing the overall transaction or order amounts from the source data and matching them with settlement data, making it easy to spot which data is fully reconciled or not.
Reconciled Records
- Matched Transactions/Orders: These are transactions/orders that match completely between the source and settlement data, including all values.
- SKU or Item-Level Matches: Shows if specific items or SKUs also match, ensuring each product line aligns.
Unreconciled Records
- Missing in Settlements: Transactions/Orders present in the source but missing from settlement data, showing potential gaps.
- Missing in Source Transactions/Orders: Values found in settlements but missing in source data, highlighting transactions/orders to check.
Detailed Mismatch Records
- Fee Mismatches: Shows any fee differences between the source and settlement.
- Tax Mismatches: Highlights any tax inconsistencies.
- Amount Mismatches: Displays transactions/orders with different values, highlighting records with mismatches.
- Unmatched SKUs or Items: Shows product-specific mismatches for more targeted resolution.
- Quantity Mismatches: Displays differences in the quantity of items/skus, which is important for inventory checks.
No Mismatch Records (Fully Reconciled)
- Fully Reconciled Data: Transactions/orders that have no mismatches, confirming accuracy.
Benefits of the Sankey Chart
- Clear Visual Insight: See reconciliation categories in one view, making it easy to spot where data matches or has issues.
- Focused Mismatch Analysis: Categories like fees, taxes, and quantities help pinpoint specific areas to resolve.
- Detailed Reconciliation: Allows tracking and checking for each SKU or quantity, ensuring accuracy down to individual items.
The Sankey Chart simplifies the reconciliation process by showing the match status of each transaction, making it easy to understand and act on reconciliation results.
Reports
Beyond the real-time insights from the Dashboard, our tool generates detailed reports for different reconciliation categories:
- Reconciled Data Reports: A summary of transactions that were successfully matched and reconciled between sources.
- Unreconciled Data Reports: Detailed reports on transactions that couldn’t be reconciled, helping highlight discrepancies that need further investigation.
- Mismatch Data Reports: Reports that focus on discrepancies in key metrics such as amounts, fees, taxes, and quantities, helping resolve inconsistencies.
- No-Mismatch Data Reports: Reports of transactions that were matched without any discrepancies, giving assurance of accuracy.
- Raw Data Present: All the reports include original raw data from each source used in reconciliation, along with final output data, allowing for deep analysis and traceability of results.
Practical Applications
- Financial Audits: Prepare for audits by using the Dashboard to generate detailed reconciliation reports that highlight discrepancies or issues.
- Compliance Monitoring: Ensure compliance with financial regulations by keeping accurate and up-to-date reconciliation records. The Dashboard helps quickly identify and resolve compliance issues.
- Strategic Decision-Making: Use insights from the Dashboard to guide business decisions, such as adjusting pricing, negotiating better rates with PSPs, or improving internal financial processes.
Conclusion
Our Dashboard is the key to a successful reconciliation process, giving businesses the insights and tools they need to keep accurate financial records, ensure compliance, and make informed decisions. With comprehensive reporting, customizable views, and a user-friendly interface, the Dashboard helps you take control of your reconciliation process and achieve greater financial transparency.
Updated 10 months ago